

If you run B2B marketing, you’ve probably heard that “employees outperform the company page on LinkedIn.” That’s true...and also too vague to greenlight a program.
What you need is a tighter set of employee advocacy LinkedIn statistics: numbers that explain why personal profiles win, what that means for reach and pipeline, and what to measure once people start posting.
Here’s the data that tends to move the conversation, plus how to act on it.
Why LinkedIn employee advocacy stats keep showing up in board decks
LinkedIn still concentrates B2B attention in a way other channels don’t. Industry benchmarks routinely put LinkedIn behind a large share of B2B social leads (often cited around 80%), which is why company pages alone feel like such a bottleneck.
The catch: organic reach on brand pages keeps getting harder. Audiences trust people more than logos, and LinkedIn’s feed rewards conversation. That’s why employee networks (not follower counts on the company page) are becoming the real distribution layer.
Reach and engagement: the core LinkedIn advocacy multipliers
These are the statistics most marketers reach for first, and for good reason.
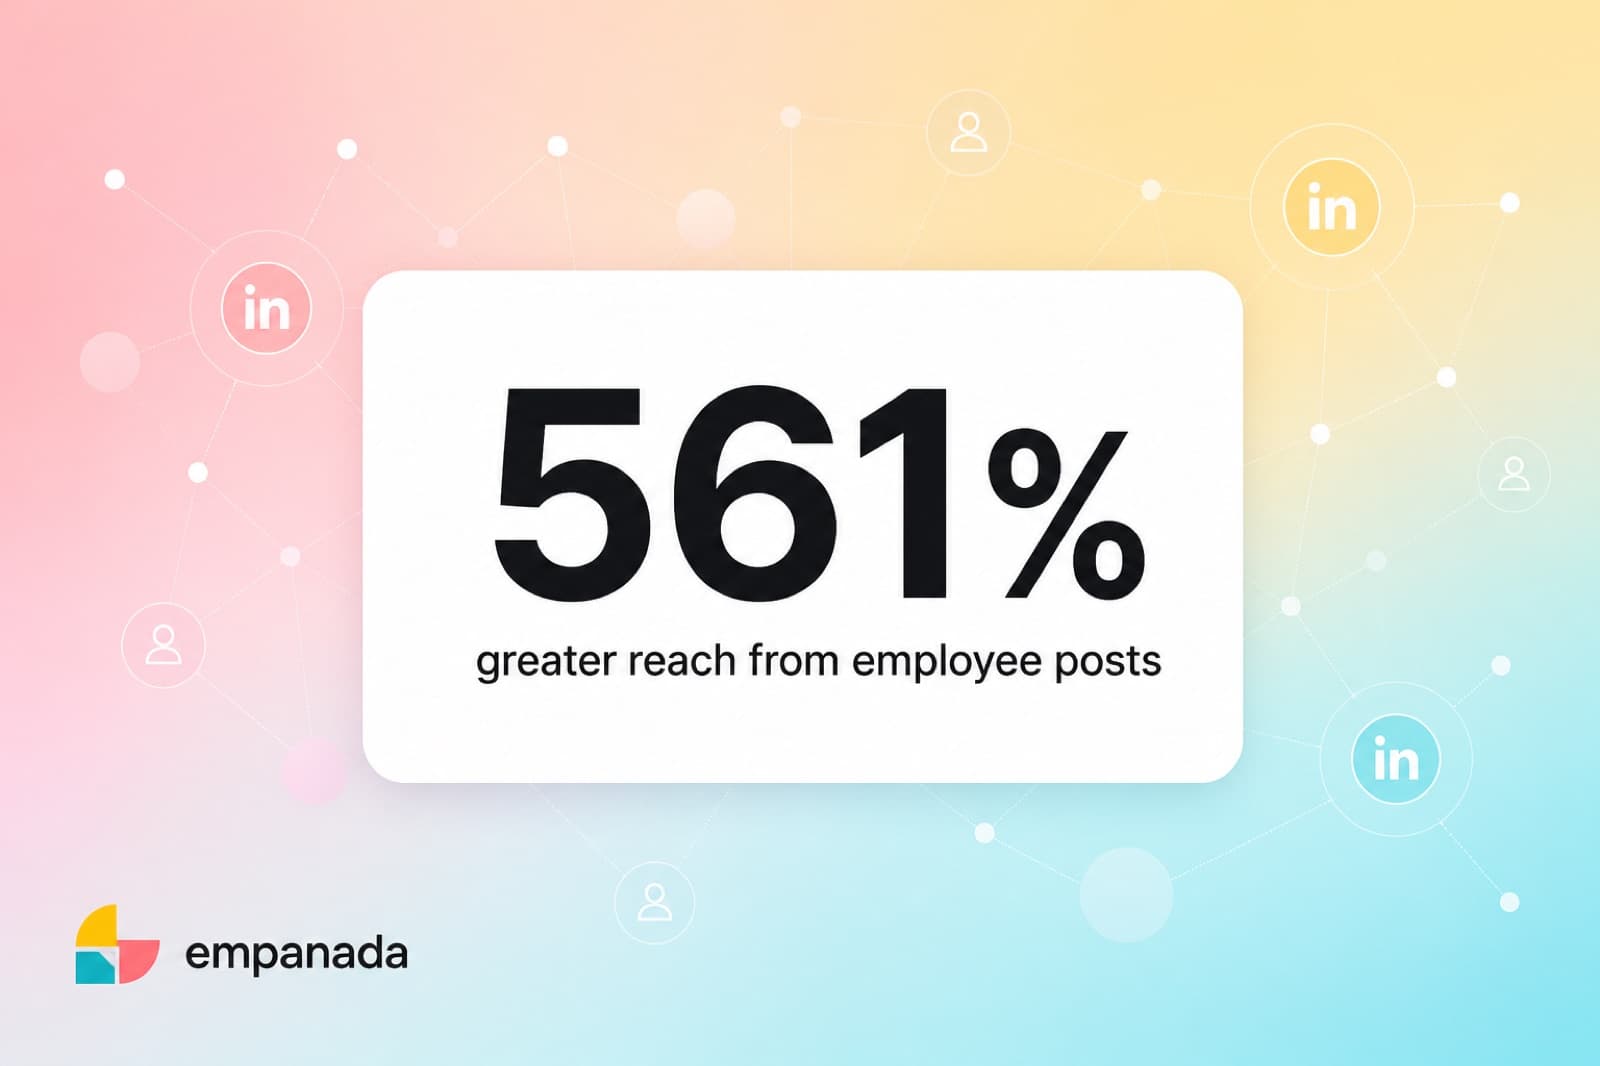
Employee shares can drive ~561% greater reach
Employee-shared content often reaches far beyond what the same message gets from brand channels alone. A widely cited figure is 561% greater reach when employees distribute content versus relying on company channels.
In practice: if your page has a few thousand followers, your team’s combined connections are usually an order of magnitude larger and they’re talking to people who don’t follow your brand yet.
Engagement lifts hard when humans post
Two related benchmarks show up again and again:
- Content shared by employees can generate about 8x more engagement than the same content shared by the brand (MSLGroup, Social Employee Advocacy Study - widely cited across the industry).
- Employee shares are also associated with roughly 24% higher engagement in many advocacy roundups, and brand messages get re-shared ~24x more when employees distribute them versus official channels (also commonly attributed to MSLGroup research).
You don’t need every study to agree on a single multiplier. The pattern is consistent: people engage with people.
Personal profiles beat pages on engagement rate
Large-scale LinkedIn analyses keep finding the same gap. One 2026 study of hundreds of thousands of posts (Metricool) reported personal profiles at about 2.60% engagement versus 1.74% for company pages - roughly 63% higher for individual voices.
That gap is why “post more from the company page” is usually the wrong first move.
Trust statistics: why employee posts convert attention into belief
Reach without trust is just noise. The trust numbers behind employee advocacy are what make LinkedIn distribution durable.
- 88% of consumers trust recommendations from people they know above other forms of advertising (Nielsen, Global Trust Study).
- Employers remain among the most trusted institutions globally in recent Edelman Trust Barometer findings - employees sit in a rare spot: institutional credibility plus personal authenticity.
- Peer / employee recommendations are routinely treated as high-trust signals in B2B buying research (often summarized as buyers trusting employee voices far more than brand messaging alone).
On LinkedIn, that trust shows up as comments, saves, DMs, and warmer sales intros, not just impressions.
Pipeline and sales: where advocacy stops being a brand metric
If your CFO only cares about pipeline, lead with these LinkedIn-adjacent advocacy stats:
- Social sellers generate 78% more opportunities than peers who don’t sell socially (LinkedIn Social Selling Index data).
- High Social Selling Index performers see roughly 45% more sales opportunities and are about 51% more likely to hit quota (LinkedIn SSI).
- Social selling strategies are associated with 20–30% shorter sales cycles (LinkedIn SSI reporting).
- Leads influenced by employee-shared messages have been reported as up to 7x more likely to convert than leads from other sources (IBM social selling case study—widely cited).
- In Hinge Research Institute’s employee advocacy research, 64% of advocates credited advocacy with helping win new business.
None of this means every reshare becomes an opportunity. It means consistent employee visibility on LinkedIn changes who already knows you before the first call.
Participation reality check (the stats most programs ignore)
The flashy multipliers only show up if people actually post. A few sobering, but useful, numbers:
- About 75% of employee advocates report getting no formal social media training from their employer (Hinge Research Institute).
- When programs do engage people, roughly 45% of participants share brand content weekly (commonly cited in advocacy program studies).
- Advocates also report personal upside: higher company visibility and stronger personal brand recognition show up consistently in Hinge’s findings. Basically, participation sticks when employees get value too.
If your program is “forward this PDF and hope,” the LinkedIn statistics above won’t materialize. Friction kills advocacy faster than lack of content.
What these LinkedIn employee advocacy statistics mean for your program
Use the data as a decision framework, not wallpaper for a slide:
- Stop optimizing only the company page. Treat employee profiles as the primary organic channel; the page supports, it doesn’t carry.
- Measure participation before vanity reach. A steady 30–40% monthly posting rate beats three power users who inflate impressions.
- Give people something worth saying. Templated “Please reshare!” posts underperform personalized takes, especially as feeds punish generic AI sludge.
- Connect marketing content to sales motion. The SSI and conversion stats only compound when sellers (and customer-facing experts) show up consistently.
- Make sharing easy. Most teams don’t fail from lack of belief—they fail from blank-page friction.
For a deeper playbook on building the motion itself, see our guide to employee advocacy and how LinkedIn-first teams run advocacy for sales.
Quick reference: employee advocacy LinkedIn statistics
| Statistic | Why it matters | Common source / citation |
|---|---|---|
| ~561% greater reach via employee shares | Distribution beyond page followers | Widely cited advocacy benchmarks |
| ~8x more engagement on employee-shared content | Depth of response + algorithmic lift | MSLGroup (widely cited) |
| ~24x more re-shares via employees | Amplification loop | MSLGroup (widely cited) |
| ~63% higher engagement rate on personal profiles vs pages | Why people > logos on LinkedIn | Metricool LinkedIn Study 2026 |
| ~80% of B2B social leads via LinkedIn | Channel concentration | Common B2B social benchmark |
| 78% more opportunities for social sellers | Pipeline case | LinkedIn SSI |
| 7x higher conversion on employee-influenced leads | Revenue case | IBM case study (widely cited) |
| 88% trust personal recommendations | Trust case | Nielsen |
Treat industry multipliers as directional. Your mileage depends on niche, posting quality, and how many people participate, but the gap between brand-only LinkedIn and team-powered LinkedIn is no longer theoretical.
Bottom line
The strongest employee advocacy LinkedIn statistics all point the same way: personal profiles win on reach, engagement, and trust—and that visibility shows up in pipeline when sales and experts participate.
If you want the whole company posting like LinkedIn rockstars—not just marketing refreshing the company page—book a demo and see how Empanada makes advocacy easy enough to stick.